Powered by Vectr Intelligence

Vectr
Synapse

No more siloed systems. No more fragmented data you can't verify. Vectr Synapse unifies it all into one trusted system, turning approved data into decisions you can act on.

Scroll to begin
The problem

Your business
runs on multiple
systems. Not one.

Not a reporting problem. A fragmentation problem.

Finance runs on one platform, operations on another, and half the business process sits in nobody's system at all. Nothing was built to talk to anything else, so someone spends their week doing the talking for it.
Inspections, sign-offs, and field readings often never make it into a digital system at all. They live on a clipboard, in a notebook, or in someone's memory, which means they never make it into a decision either.
Most platforms are built for one industry, one process, or one data shape, then bent to fit everything else. You end up managing the tool's limitations instead of your operation.
As operations grow, so does the number of systems, sites, and formats you have to reconcile. Manual processes and rigid, single-purpose software both have a ceiling. Neither one scales with you.
Platform architecture

One system.
Every process.

Each layer configures to your business, not the other way around, and each depends on the integrity of the one below it.

L1: FOUNDATION

Every source, one record

Pulls data from every system you already run, ERP, finance, operations, spreadsheets, and more, and consolidates it into a single approved, traceable record your whole business can rely on.

L2: DIGITISATION

Turn manual processes digital

Where a process still lives on paper, a clipboard, or in someone's head, build a form directly in the system to capture it: inspections, sign-offs, and field readings. That data becomes part of the same platform used for every insight and query.

L3: INSIGHT LAYER

Out in whatever format you need

The same approved data flows out as a live dashboard, a PowerPoint pack, an Excel model, a PDF, or a web report, on whatever schedule your business runs on.

L4: AI LAYER

The intelligence

Turns data into plain-language summaries automatically, and answers questions by text instead of a dashboard. Configure the checks that matter to your operation, and agents quietly handle the follow-ups in the background.
Platform stack
AI Layer  ◆ Vectr IntelligenceL4
Insight LayerL3
DigitisationL2
FoundationL1
Connects to SAP, Sage, AVA, SharePoint, REST APIs, Excel, weighbridges, SCADA, paper forms, and more.
Platform architecture

One system.
Every process.

Each layer configures to your business, not the other way around, and each depends on the integrity of the one below it. Tap a layer to expand it.

Pulls data from every system you already run, ERP, finance, operations, spreadsheets, and more, and consolidates it into a single approved, traceable record your whole business can rely on.
Where a process still lives on paper, a clipboard, or in someone's head, build a form directly in the system to capture it: inspections, sign-offs, and field readings. That data becomes part of the same platform used for every insight and query.
The same approved data flows out as a live dashboard, a PowerPoint pack, an Excel model, a PDF, or a web report, on whatever schedule your business runs on.
Turns data into plain-language summaries automatically, and answers questions by text instead of a dashboard. Configure the checks that matter to your operation, and agents quietly handle the follow-ups in the background.
See it in action

One system.
Configured to your business.

Real screens from a live Vectr Synapse workspace: dashboards, reports, charts, data capture, and the AI assistant, all in one configurable platform. Hover or tap a screen to pause and read it.

SEE IT IN ACTION
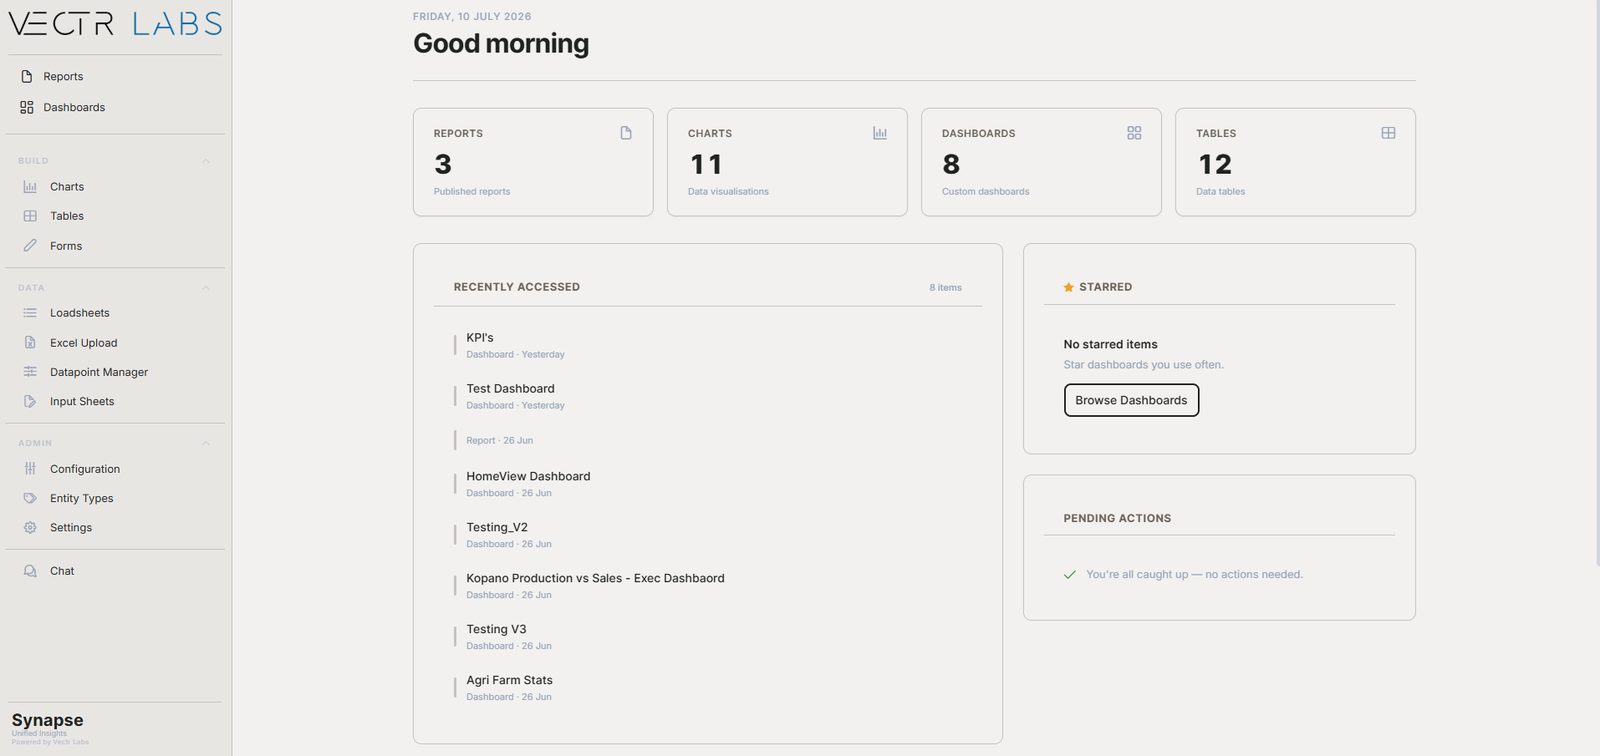
Vectr Synapse home overview, showing reports, charts, dashboards, and recently accessed items
Home: Overview
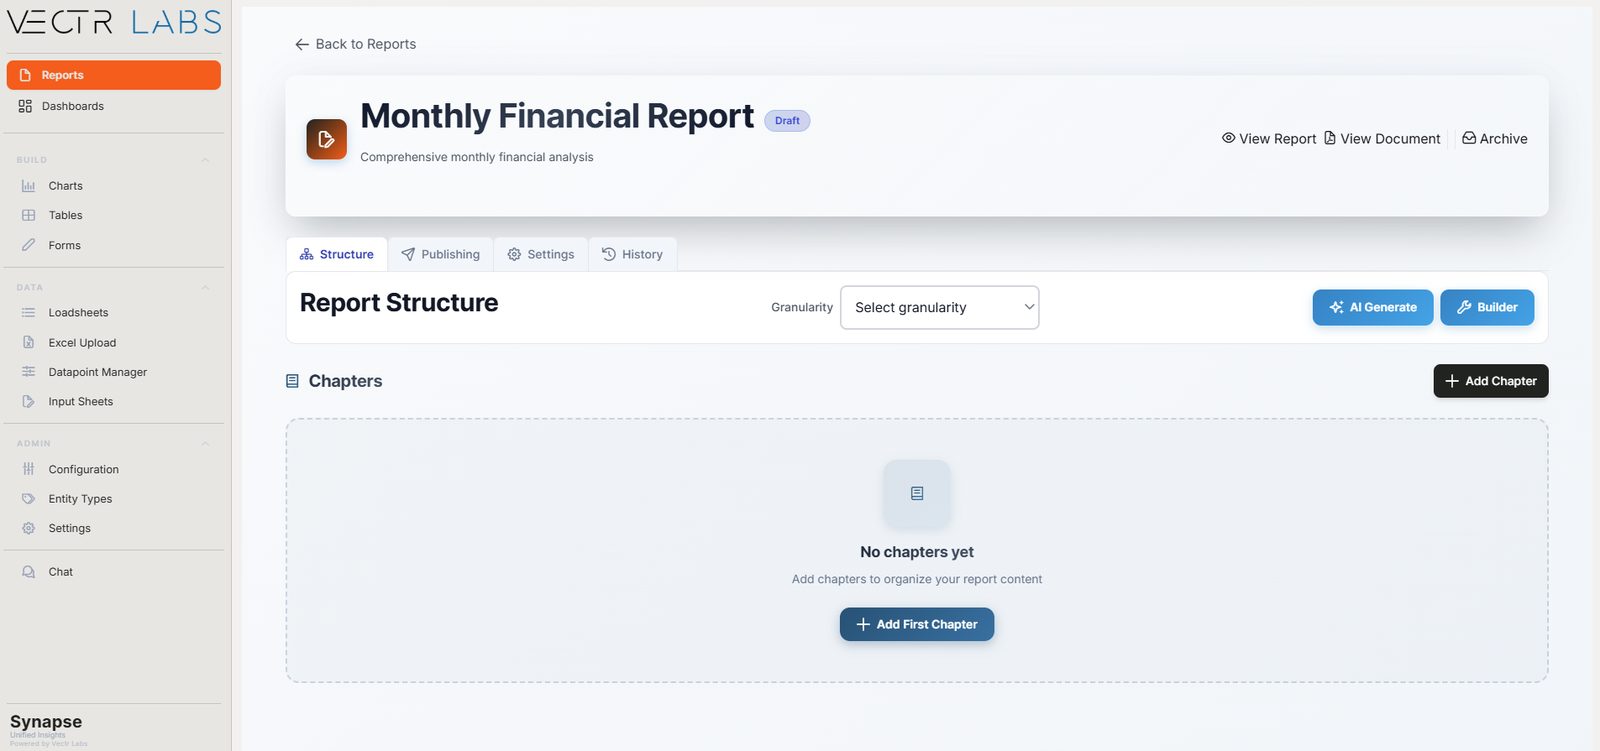
Vectr Synapse report structure builder with AI generate and manual builder options
Reports: Structure builder
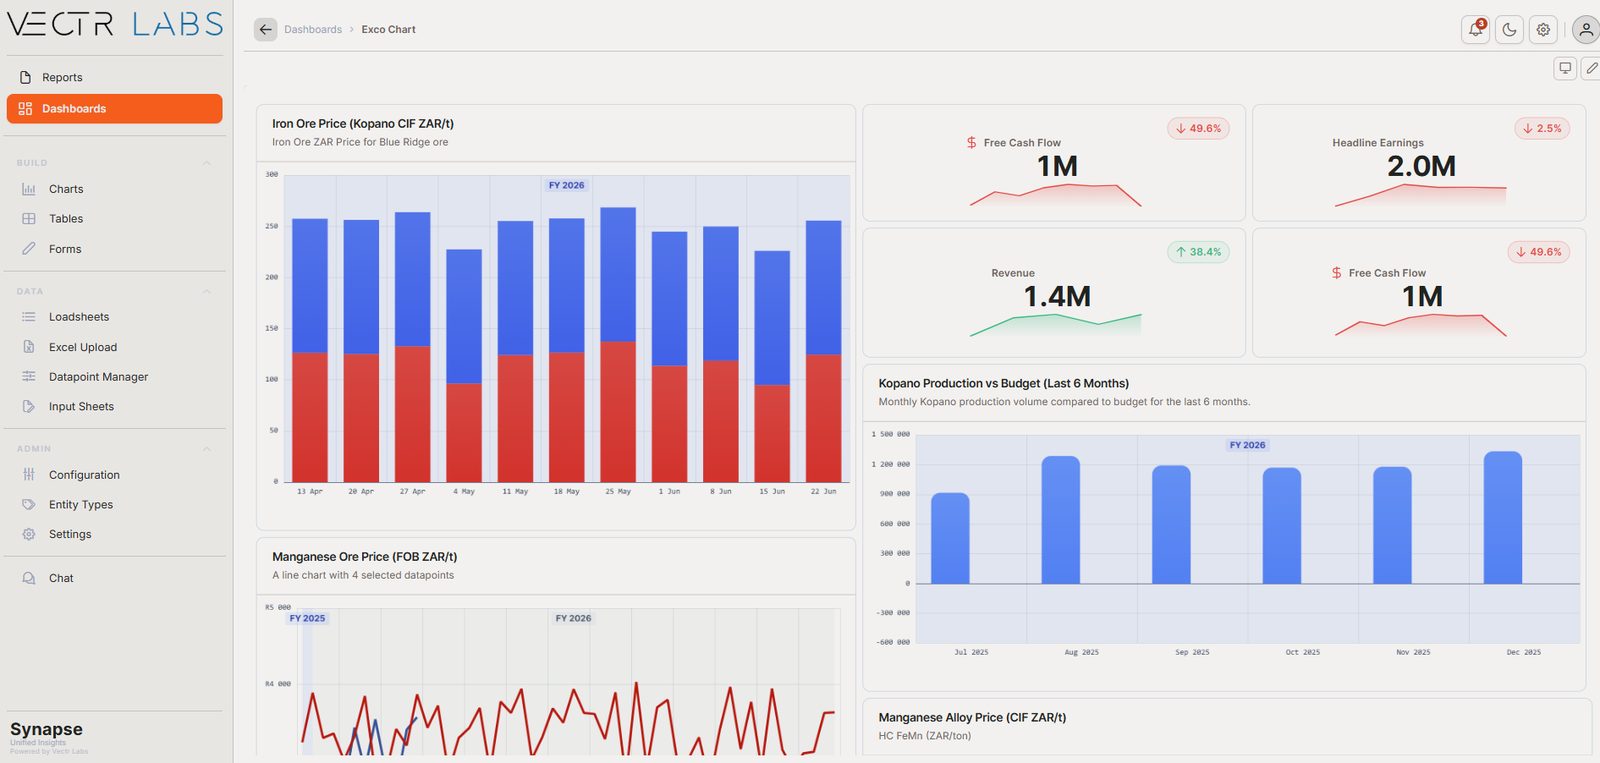
Vectr Synapse executive dashboard showing production, pricing, and cash flow KPIs
Dashboards: Executive view
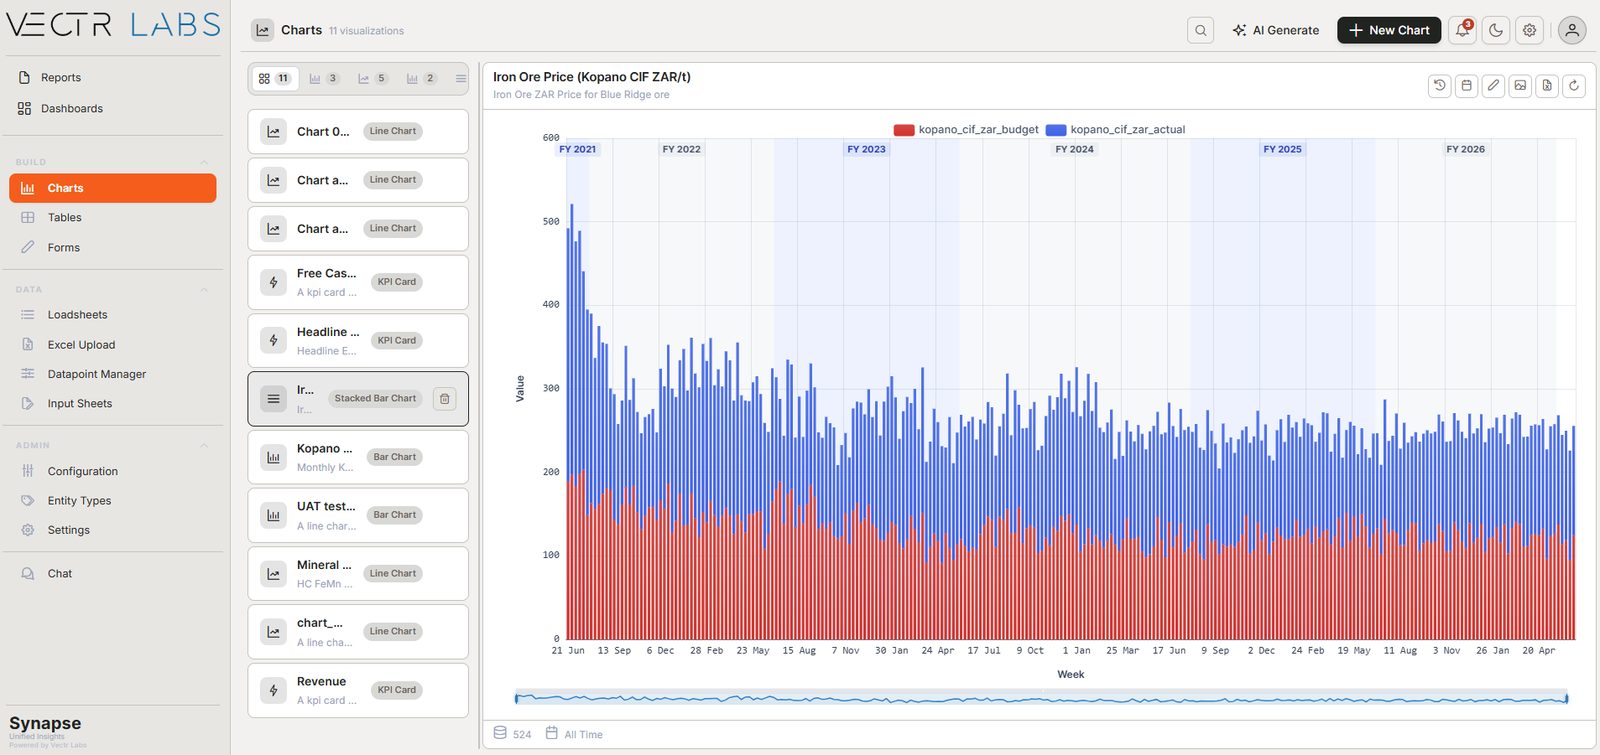
Vectr Synapse charts library with an Iron Ore price chart selected
Charts: Library
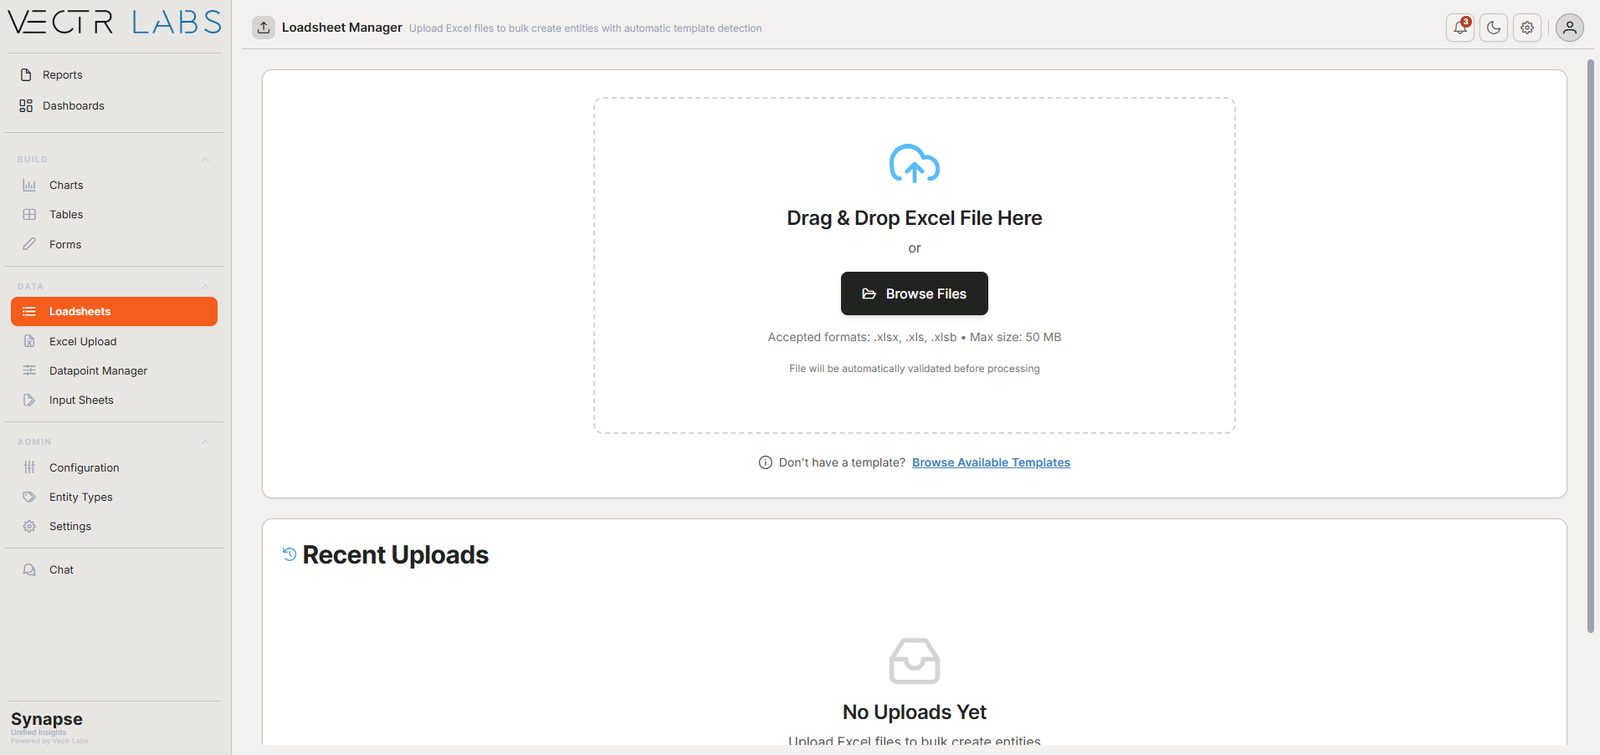
Vectr Synapse loadsheet manager for bulk Excel uploads
Data: Loadsheet manager
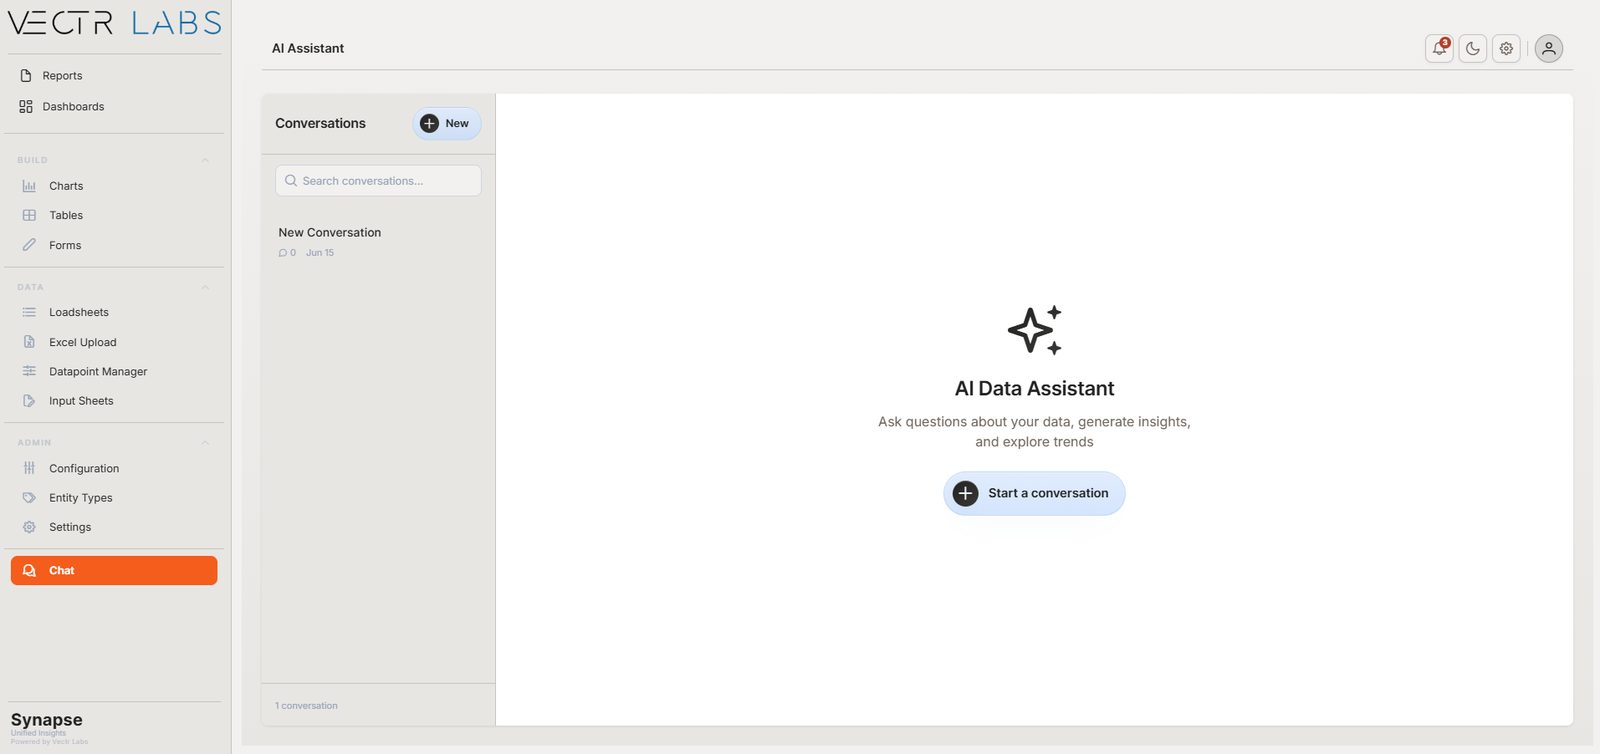
Vectr Synapse AI data assistant chat interface
Vectr Intelligence: AI assistant
Why Vectr Synapse
CapabilityVectr SynapseTraditional approach
System type
A dynamic enterprise system with built-in workflows and process logic, configured to run your business, not just store it
A static repository of raw data, requiring separate BI and workflow tools built on top
Fit to your operation
Configured around your specific processes and data, not a generic template
A generic template, bent to fit your business after the fact
Setup and configuration
Configured quickly around your process, no lengthy IT project required
Requires IT, developers, or consultants to configure and maintain
Manual and paper-based data
Configurable forms digitise processes that have never been captured electronically
Manual data stays manual, or requires a separate digitisation project
Data foundation
Connects and cleans every datapoint against checks you configure, then routes it for approval before it counts
Assumes data is already clean. Garbage in, garbage out
Outputs
Dashboards, PowerPoint, Excel, PDF, and live web reports, all from the same source
Locked into one output format, usually a dashboard
AI capability
AI-driven summaries, custom AI agents, and plain-language Q&A built in
Basic AI bolt-on or none
Audit and compliance
Full audit trail. Every number traceable to its source, approver, and timestamp
No built-in approval workflow or data lineage
Deployment
Live in 2 to 3 months. Maintained SaaS platform with continuous updates
6 to 12 month implementation. Often a custom build that degrades over time
Vectr Intelligence

The AI layer that
changes everything.

Vectr Intelligence is Vectr Labs' proprietary AI layer, built directly into Vectr Synapse. It works like an expert who already knows your data: surfacing connections you'd otherwise miss, automating checks and routine decisions through rules you set, and moving from a high-level summary down into the detail on demand.

It runs securely inside your own environment, reasoning only over your approved data by default and reaching into the open internet only when you ask. It also gets sharper over time, not by training itself, but as you refine context and more data flows through it.

Proof, not promises

Results from real operations.

Case study · 01Bulk commodity mining · Financial reporting

From a two-week reporting cycle to same-day delivery.

"The report used to take the team a fortnight. Now it's just there."

01 · The challenge
Two weeks lost to manual consolidation
Finance pulled data from multiple ERPs and spreadsheets to build one board pack. By the time it was ready, the numbers were already outdated.
02 · What we did
Connected the sources, automated the pack
Automated consolidation, reconciliation, and report generation against pre-built corporate templates. No manual steps in the pipeline.
03 · The outcome
Same-day reporting, zero compilation
Reporting cycle reduced from two weeks to same-day. Finance fully redirected from data compilation to strategic analysis.
Case study · 02Underground metals mining · BEV fleet management

Keeping battery-electric vehicles moving.

"For the first time, we had a live picture of every vehicle and every charger in one place."

01 · The challenge
Unpredictable charging, invisible fleet
No live picture of the fleet. Charge levels, bay availability, and vehicle locations sat in disconnected systems. Disconnects went unnoticed.
02 · What we did
Live battery monitoring and fleet coordination
Pulled real-time state of charge, charger status, and vehicle location into one view, with automated alerts and live dashboards.
03 · The outcome
Predictable, efficient fleet operations
28% reduction in battery disconnects per month across the BEV fleet. Reactive fleet management became proactive coordination, with no added headcount.
Case study · 03Underground hard rock mining · Drill optimisation & blast performance

From guesswork to precision drilling.

"We could finally see exactly where the plan and reality were diverging, and fix it before the blast."

01 · The challenge
Blast-hole positions routinely missed
Planned and actual drilling routinely diverged: blast-hole positions and depths were missed, reducing blast effectiveness and increasing rework, with no visibility into where the deviation was happening.
02 · What we did
Real-time drill optimisation and visualisation
Built a tool comparing planned hole layouts against actual drilled data in near-real time, surfacing depth variances and positional deviations directly to supervisors and operators on shift.
03 · The outcome
Safer, more predictable operations
Reduced hole deviation and depth mismatch. Lower rework and explosives waste. Operators held to clear, visible performance data.
Case study · 04Open-pit precious metals mining · Fleet maintenance

From reactive breakdowns to data-driven maintenance.

"We went from chasing breakdowns to getting ahead of them."

01 · The challenge
Reactive maintenance masking real cost
A 65:35 breakdown-to-planned ratio, premature engine failures, and bottom-quartile maintenance OPEX. The data existed, but it was fragmented and underused.
02 · What we did
Unified data, predictive analytics
Consolidated all maintenance and operational data into one scalable database, and built AI-driven predictive maintenance tools to shift toward a data-driven centre of excellence.
03 · The outcome
Anticipating failures, not chasing them
Significant reduction in engine failures, an improved breakdown-to-planned ratio, and maintenance OPEX out of the bottom quartile.

Ready to see it
in your operation?

We map your data landscape and show you exactly what Vectr Synapse would deliver.